
Note: This is the Solution of review exercise 12.1 from newly published book by PCTB (Punjab Curriculum and Textbook Board, Pakistan) for new 9th session 2025 Onward.
Exercise 12.1
Question # 01: The following distribution represents the scores achieved by a group of chemistry students in the chemistry laboratory.
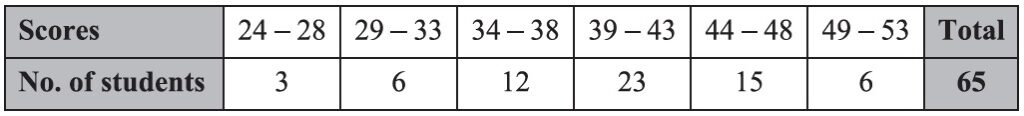
Answer the following questions.
\( (i) \; \) What is the upper limit of the last class?
\( (ii) \; \) What is the lower limit of the class \(39-43\)
\( (iii) \; \) What is the midpoint of the class \((34-38)\)?
\( (iv) \; \) What are the class frequencies of the classes \(29-33\) and \(44-48\)?
\( (v) \; \) What is the size of the class limits in the above frequency distribution?
\( (vi) \; \) In which class or group does minimum number of students fall?
\( (vii) \; \) What is the lower limit of the class having \(15\) as its class frequency?
\( (viii) \; \) What is the number of students having scores between \(24\) and \(43\)?
Question 2: For a school staff, the following expenditures (rupees in hundred) are required for the repair of chairs.
145, 152, 153, 156, 158, 160, 146, 152, 155, 159, 161, 163, 165, 147, 148, 151, 154, 156, 158, 160, 144, 167, 151, 150, 152, 149, 145, 153, 152, 155
Prepare a frequency distribution by tally bar method using \(\small{3}\) as the size of class limits and also write down what are the frequencies of the last three classes?
Question 3: Given below are the weights in \(\small{kg}\) of \(\small{30}\) students of a high school.
30, 33, 24, 21, 15, 39, 37, 44, 42, 33, 33, 28, 29, 32, 31, 28, 26, 32, 34, 35, 38, 36, 41, 30, 35, 41, 23, 26, 18, 34
Taking \(\small{5}\) as the size of the class limit, prepare a frequency table and construct a frequency polygon.
Question 4: A group of Grade-10 students obtained the following marks out of 100 marks in English tes.
58, 59, 58, 33, 40, 58, 45, 46, 43, 45, 45, 50, 52, 49, 50, 57, 52, 55, 49, 50, 62, 49, 48, 44, 42, 47, 46, 47, 46, 53, 40, 44
Classify the data into a frequency distribution by (direct method) taking 6 as the size of class limit. Also find the class limit with least class frequency and construct histogram for the dat.
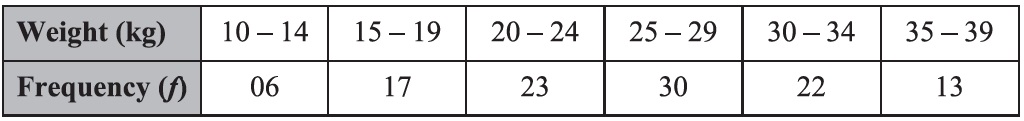
Question 5: From the table given below. Draw a frequency polygon on histogram for the given frequency distribution.
Question 6: The following data shows the number of heads in an experiment of 50 sets of tossing a coin 5 times. Make a discrete frequency distribution from the information.
3, 3, 4, 0, 5, 4, 3, 3, 1, 2, 4, 5, 0, 3, 2, 4, 4, 0, 0, 0, 5, 5, 3, 2, 1, 4, 3, 2, 5, 3, 2, 1, 3, 5, 4, 3, 2, 1, 3, 2, 1, 3, 1, 3, 1, 4, 3, 2, 2, 4
Question 7: The marks obtained by the students of Grade-10 in mathematics test were grouped into the following frequency distribution.
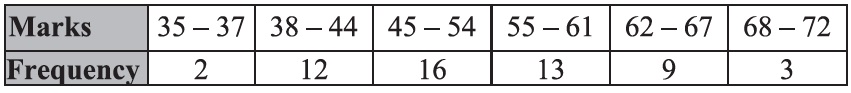
Draw a histogram for the above distribution.
Question 8: Make a frequency polygon on histogram for the following grouped data:
