Note: This is the Solution of review exercise 12 from newly published book by PCTB (Punjab Curriculum and Textbook Board, Pakistan) for new 9th session 2025 Onward.
Review Exercise 12
Question # 01: Four option are given against each statement. Encircle the correct option.
\((i)\) Which data takes only some specific values?
\( a) \quad \) continuous data
\( b) \quad \) discrete data
\(c) \quad \) grouped data
\( d) \quad \) ungrouped data
\( \text{Answer/Explanation}\)
\((ii)\) the number of times a value occurs in a data is called:
\( a) \quad \) frequency
\( b) \quad \) relative frequency
\(c) \quad \) class limit
\( d) \quad \) class boundaries
\( \text{Answer/Explanation}\)
\((iii)\) Midpoint is also known as:
\( a) \quad \) mean
\( b) \quad \) median
\(c) \quad \) class limit
\( d) \quad \) class mark
\( \text{Answer/Explanation}\)
\((iv)\)\(\quad\)Frequency poly is also drawn/constructed by using:
\( a) \quad \) histogram
\( b) \quad \) bar graph
\(c) \quad \) class boundaries
\( d) \quad \) class limit
\( \text{Answer/Explanation}\)
\((v)\) \(\quad\)The difference between the greatest value and the smallest value is called:
\( a) \quad \) class limits
\( b) \quad \) midpoint
\(c) \quad \) relative frequency
\( d) \quad \) range
\( \text{Answer/Explanation}\)
\((vi)\) \(\quad\) Measure of central tendancy is used to find out _______ of a data set.
\( a) \quad \) class boundaries
\( b) \quad \) cumulative frequency
\(c) \quad \) middle or centre value
\( d) \quad \) frequency
\( \text{Answer/Explanation}\)
\((vii)\)\(\quad\)It the mean 5, 7, 8, 9 and \(x\) is 7.5, what will be the value of \(x\)?
\( a) \quad \) 10
\( b) \quad \) 8
\(c) \quad \) 8.5
\( d) \quad \) 5.8
\( \text{Answer/Explanation}\)
\((viii)\)\(\quad\) Find the mode of the given data: 2, 5, 8, 9, 0, 1, 3, 7 and 10
\( a) \quad \) 5
\( b) \quad \) 7
\(c) \quad \) 0
\( d) \quad \) no mode
\( \text{Answer/Explanation}\)
\((ix)\)\(\quad\)In a data the values (observation) which appears or occurs most often is called
\( a) \quad \) mean
\( b) \quad \) mode
\(c) \quad \) median
\( d) \quad \) weighted mean
\( \text{Answer/Explanation}\)
\((x)\) \(\quad\)Find the median of the given data: 110, 125, 122, 130, 124, 127, and 120
\( a) \quad \) \(124\)
\( b) \quad \) \(120\)
\(c) \quad \) \(125\)
\( d) \quad \) \(127\)
\( \text{Answer/Explanation}\)
Question 2: Define the following:
\( (i) \; \) frequency distribution
\( (ii) \; \) histogram (unequal class limits)
\((iii) \; \) mean
\( (iv) \; \) median
Question 3: Following are teh weights of 40 students recorded to the nearest (lbs).
138, 164, 150, 132, 144, 125, 149, 157, 146, 158, 140, 147, 136, 148, 152, 144, 168, 126, 138, 176, 163, 119, 154, 165, 146, 173, 142, 147, 135, 153, 140, 135, 161, 145, 135, 142, 150, 156, 145, 128
Make a frequency table taking size of class limits as 10. Also draw histogram and frequency polygon of the given data.
Question 4: From the table given below. Draw a frequency polygon on histogram for the given frequency distribution.
Question 5: Given below are marks obtained by 45 students in the monthly test of Biology:
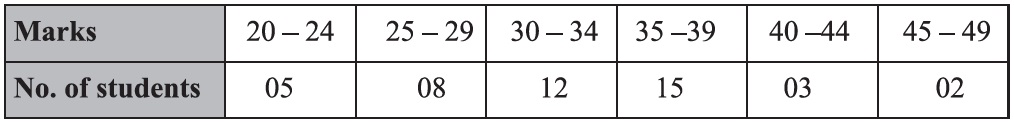
With reference to the above table find the following:
\( (i) \; \) upper class boundary of the \(5^{th}\) class.
\( (ii) \; \) lower class boundaries of all the classes.
\( (iii) \; \) midpoint of all the classes.
\( (iv) \; \) the class interval with the least frequency.
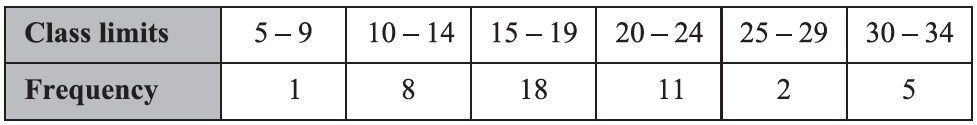
Question 6: Given below is frequency distribution.
Draw frequency polygon and histogram for the distribution.
Question 7: For the following dat, find the weighted mean.
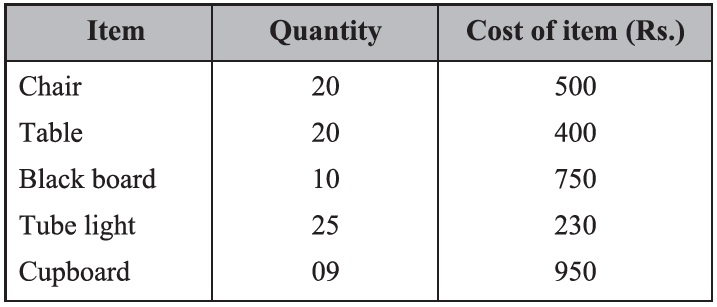
Question 8: A principal of a school allocates funds of Rs. 50,000 to five different sectors:
\( (i) \; \) chairs: Rs. 15000
\( (ii) \; \) tables: Rs. 12,000
\((iii) \; \) black boards: Rs. 6000
\( (iv) \; \) room renovation: Rs. 10,000
\( (v) \; \) gardening: Rs. 7000
Find the average of funds allocation in each sector of the school.
Question 9: The marks of a student Saad in six tests were 84, 91, 72, 68, 87, 78. Find the arithmetic mean of his marks.
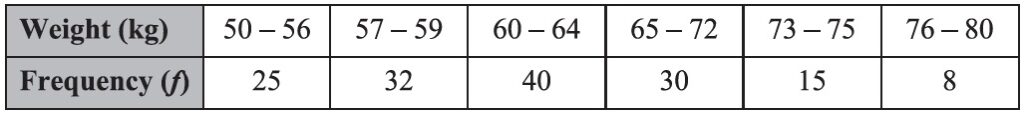
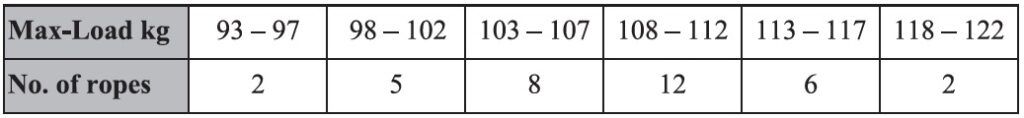
Question 10: Adjoining distribution showed maximum load (in kg) supported by certain ropes. Find the mean load using short method.
Question 11: Usman rolled a fair dice eight times. Each time their sum was recorded as 8, 5, 6, 6, 9, 4, 3, 11. Find the median and mode of the sum.
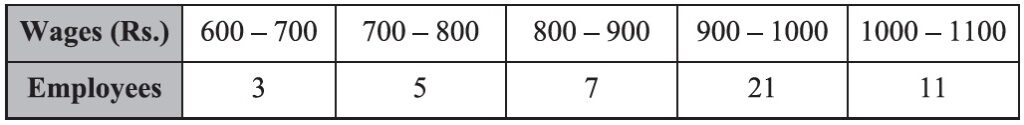
Question 12: Two partnes Mr. Aslam and Mrs. Kalsoom run a company. In the following data the weekly wages (in Rs.) of employees who work in the company are given: